


On 8-9 June 2026, FI Group by EPSA participated in the European Association of Innovation Consultants (EAIC) Annual General Meeting in Zagreb, Croatia.
EAIC is a European association representing innovation consultancy firms and supporting dialogue between consultants, institutions and industry on research, development and innovation funding policy.
The event brought together key stakeholders from EU institutions, industry and consultancy to discuss the future of innovation funding in Europe, with a particular focus on the next European long-term budget for research and innovation, the Multiannual Financial Framework (MFF) 2028-2034.
These discussions are highly relevant for organisations seeking to anticipate how European innovation funding will evolve in the coming years.
FI Group by EPSA’s participation in the EAIC AGM reinforces its position as an active contributor to the development of European innovation policy and funding frameworks.
By being present where key decisions are discussed and shaped, FI Group by EPSA gains early visibility of policy and programme developments while contributing to the design of future funding mechanisms. This enables the company to create tangible value for clients by:
This involvement supports FI Group by EPSA’s ability to provide clients with forward-looking insight, stronger strategic guidance and a clearer understanding of future EU funding programme opportunities.
During the EAIC AGM, Luca Pira, Public Affairs and International Grant Manager and Coordinator of the National Funding Schemes Working Group, played a central role in both implementation and strategic discussions as part of the Working Group Coordinators panel.
In this context, he presented FI Group by EPSA’s contributions to key topics, including the future design of EU innovation funding at national and regional level under the MFF 2028-2034, as well as regulatory and State aid frameworks.
This included input into the recent public consultation on the General Block Exemption Regulation, where FI Group by EPSA contributed as part of a coordinated effort at both national and European level alongside key industry associations: the European Association of Innovation Consultants (EAIC), the Asociación Española para el Fomento de la Financiación de la I+D+i (AFIDI), the Associazione Italiana per la Ricerca Industriale (AIRI), and BusinessEurope.
Luca also highlighted upcoming work on a European comparative report on R&D and technological innovation incentives, coordinated by Víctor Cruz, Regulatory, Public Affairs & Strategy Director. This further demonstrates FI Group by EPSA’s expertise in tax incentives and regulatory intelligence.
FI Group by EPSA’s active participation in the EAIC AGM also strengthens its international partner network, particularly in countries and regions where the company does not yet have a direct presence, such as Croatia and the broader Balkan region.
These markets are becoming increasingly strategic within the European innovation landscape. Through EAIC, FI Group by EPSA is also able to leverage collective advocacy capacity at European level, enhancing its influence on policy and funding frameworks beyond what a single organisation could achieve independently.
This approach creates stronger opportunities for FI Group by EPSA and its clients in international and cross-border innovation initiatives.
Active engagement across EAIC Working Groups
FI Group by EPSA is actively engaged in several EAIC Working Groups, covering:
This involvement strengthens the company’s expertise, expands its network and enhances its ability to anticipate and shape market trends.
As Europe defines its next innovation funding cycle, FI Group by EPSA will continue to contribute actively within EAIC, remaining at the forefront of policy and programme developments. This includes participation in the EAIC Summit on the Future of Funding in Europe, taking place on 3 November 2026 in Brussels. The event is expected to feature speakers such as MEP Christian Ehler, a key figure in EU research and innovation policy, who plays a leading role in shaping the MFF 2028–2034 and the upcoming FP10.
This engagement is aligned with a broader shift in the sector: from a primarily operational role focused on identifying opportunities and preparing applications, towards a more strategic advisory role. This requires the ability to combine technical, financial and regulatory expertise to position projects, structure partnerships and support clients across the full innovation lifecycle.
By leveraging EAIC’s collective advocacy capacity at European level, FI Group by EPSA strengthens its ability to influence frameworks, anticipate change and create tangible value for clients, while reinforcing its competitive position in the European innovation funding landscape. FI Group by EPSA can support organisations in identifying upcoming opportunities, interpreting regulatory changes and positioning projects for future funding success.
European funds for businesses have become one of the most relevant drivers for supporting business projects linked to innovation, sustainability, digitalisation and industrial development.
The European Union structures a range of programmes that channel resources towards strategic initiatives, including Next Generation EU, ERDF funds, and calls under the Horizon Europe programme, each with complementary objectives and approaches. Understanding how these instruments operate, what opportunities they offer and which criteria determine access is essential for companies to anticipate calls and position their projects with a greater likelihood of success.
To support the planning of European funds for businesses, we provide an European calls, enabling organisations to identify key dates and the most relevant opportunities for each type of company.
European funds for businesses are financial instruments created by the European Union to support projects that promote economic growth, competitiveness and the transition towards a more innovative and sustainable model. Their purpose is to channel resources into initiatives that enable companies to:
These grants are structured through different programmes aligned with specific priorities. Some encourage investment aimed at modernising production processes or adopting advanced technologies, while others finance R&D&I activities, decarbonisation actions, or projects that reinforce territorial cohesion through new industrial capabilities. This diversity of objectives makes it easier for companies of different sizes and sectors to find funding schemes suited to their project needs.
The importance of European funds for businesses lies in their ability to reduce financial barriers and facilitate the launch of initiatives that require significant investment. They also help accelerate transformations that would be more complex to undertake using internal resources alone. In a competitive and constantly evolving environment, they represent a strategic tool to drive business innovation, strengthen sustainability and align investments with EU priorities in energy transition, digitalisation and industrial development.
The funds have enabled European funding for businesses to support projects related to digitalisation, energy transition, industrial innovation and process modernisation, financing strategic initiatives that require substantial investment. Their main contribution has been to provide resources for transformations that enhance competitiveness and support adaptation to EU priorities in areas such as energy efficiency, sustainable mobility and technological development.
However, this instrument is temporary, with a clearly defined timeframe: its implementation period ends in August 2026, placing organisations at a decisive moment. Spain has launched various calls through the Recovery, Transformation and Resilience Plan, including strategic programmes such as the PERTEs, enabling companies across different sectors to access funding for high‑impact projects.
The final phase brings a more demanding environment: increased competition, limited scope to refine proposals, and a clear need to progress with the execution of already approved projects. At this stage, the ability to define solid initiatives aligned with the plan’s priorities is decisive in making the most of the European funds for businesses available before the programme officially closes.
The European Regional Development Fund (ERDF) is one of the key European funds for businesses within the EU’s cohesion policy. Its purpose is to reduce territorial disparities and support economic development through investments that strengthen competitiveness, promote innovation and encourage the transition towards more sustainable production models.
In the 2021–2027 period, ERDF resources are focused on five main priorities:
For companies, ERDF represents a stable source of funding, with active calls in Spain through regional and national programmes. Aid intensity varies by autonomous region, with higher percentages in less developed or transition regions, enabling business projects at different maturity levels to access resources adapted to their territorial context.
Horizon Europe is one of the main European funds for businesses supporting research and innovation projects with a direct impact on business competitiveness. Its financial framework strengthens opportunities over the coming years: The European Commission has allocated €14 billion for the period 2026–2027, securing a significant amount of funding for technological, scientific and industrial development initiatives.
For companies, this programme offers funding aimed at high value‑added projects, including the development of new technologies, advanced digital solutions, and initiatives related to climate and energy, mobility, health, artificial intelligence or deep tech. It also includes specialised instruments such as the European Innovation Council (EIC), which supports startups, scaleups and companies with disruptive projects seeking to increase technological maturity and accelerate market entry.
Horizon Europe requires a higher level of technical preparation, specialised consortia where required by the call, and clear alignment with European missions and priorities. For organisations with a robust innovation strategy, it represents an opportunity to finance ambitious developments, position themselves within strategic value chains and access international collaborations that strengthen long‑term competitiveness.
Other programmes fund R&I projects in specific fields, such as industrial decarbonisation, green and digital transitions, defence capabilities, connectivity infrastructure, culture, or health. These include instruments like the Innovation Fund, the LIFE Programme, the Digital Europe Programme, the European Defence Fund, the Connecting Europe Facility, the Erasmus+ Programme, EU4Health, and InvestEU, among others.
European funds for businesses support initiatives with a clear impact on competitiveness, sustainability and innovation. The most common types of project include:
Accessing European funds for businesses requires sound technical preparation and a clear strategy to ensure that the project complies with the priorities and criteria of each funding scheme. The typical steps include:
FI Group by EPSA works on a daily basis with business projects seeking to access European funding for companies, and this experience reveals a clear pattern: success depends not only on drafting a proposal, but also on correctly interpreting the criteria valued in each call for proposals and structuring projects accordingly.
This requires rigorous technical analysis to define objectives, justify the impact and tailor the scope to what is actually funded. This initial phase is crucial for avoiding deviations, ensuring consistency and increasing the chances of selection, particularly in highly competitive calls for proposals with demanding requirements.
During implementation, documentation management and compliance with milestones also directly affect the continuity of funding. FI Group by EPSA supports companies throughout this process to ensure that implementation remains aligned with approvals and that each action is properly justified — essential in programmes where deviations can affect the final payment.
This integrated approach enables companies to proceed with greater confidence on projects involving innovation, digitalisation or industrial growth, taking advantage of the European funds available to help businesses strengthen their competitiveness and accelerate transformations that would otherwise require greater internal resources or longer timelines.
Space-based technology has become one of the most powerful tools in tackling the global challenge of climate change and decarbonisation. From Earth observation satellites that monitor greenhouse gas emissions to advanced propulsion systems that reduce launch footprints, innovation in space technology is critical to achieving net-zero targets.
For SMEs and scale-ups in Europe and the UK, this sector offers a dual opportunity: driving technological breakthroughs while accessing substantial public and private funding. Yet navigating this landscape requires strategic insight. Each scheme has unique compliance demands, funding structures, and cross-border implications, and CFOs face increasing pressure to align innovation spend with decarbonisation goals while ensuring strong ROI.
This article provides a comprehensive roadmap of the funding available across Europe and the UK, from the European Space Agency (ESA) to Horizon Europe and national schemes. It also highlights the CFO pain points in financing innovation, and explains how FI Group’s “Global Reach. Local Expertise.” approach enables clients to maximise returns while reducing compliance risks.
| Programme | Budget (2021–2027) | Focus Areas | Typical Funding Size | Relevance to Space Decarbonisation |
| Horizon Europe | €95.5bn | Climate, Energy, Digital, Space | €500k–€15m | Collaborative R&D, space-enabled sustainability |
| EIC Accelerator | €10bn (subset of Horizon) | Deep-tech, disruptive innovation | Up to €2.5m grant + €15m equity | Hardware/software scale-ups in climate & space |
| ESA Clean Space | €180m+ since 2010 | Green design, debris mitigation | €50k–multi-million | Clean propulsion, eco-satellites, reusability |
| LIFE Programme | €5.43bn | Environment & climate action | €1m–€10m | Climate services, space-enabled adaptation |
| UK Space Agency | £100m+ annual calls | Space science, sustainability | £50k–£15m | National missions (e.g. CO₂ monitoring) |
| Innovate UK Net Zero | £1bn+ portfolio | Clean energy, mobility, data | £50k–£2m | Satellite data for net-zero mobility, energy |
Space technology for decarbonisation refers to the application of space-based tools and services to reduce carbon emissions, improve resource efficiency, and accelerate the transition to net-zero economies. Examples include:
This convergence of space, sustainability, and digital technology creates new commercial opportunities but requires significant upfront investment, hence the growing importance of grant funding and R&D tax incentives.
CFOs in innovation-driven SMEs face three recurring challenges:
In a climate where venture capital funding has declined year on year since 2021, grants and tax incentives are becoming the most reliable growth levers for high-tech firms.
The ESA runs multiple programmes aligned with sustainability and space innovation:
ESA grants often require international collaboration, making FI Group’s network across 13 countries a decisive advantage in forming and managing consortia.
With a €95.5 billion budget (2021–2027), Horizon Europe is the EU’s largest funding programme for research and innovation. For space decarbonisation, key clusters include:
The European Innovation Council (EIC) Accelerator within Horizon Europe also offers up to €2.5 million in grants plus blended finance, particularly relevant for scale-ups in green and space technologies.

The UK’s national innovation agency Innovate UK regularly opens competitions relevant to space and decarbonisation, such as:
Through targeted calls, the UK Space Agency co-funds ESA projects and runs initiatives on space debris mitigation and low-carbon satellite technologies.

For UK SMEs, R&D tax relief remains a crucial complementary mechanism. Costs not covered by grants can often be claimed under the merged R&D Expenditure Credit (RDEC) scheme, offering a ~20% taxable credit on qualifying costs. CFOs must carefully structure projects to avoid “double-dipping”, where the same cost is claimed twice under different schemes, a compliance risk that FI Group’s integrated advisory model helps mitigate.
While venture capital remains the largest pool of growth finance, the market has cooled significantly since 2021. UK deal volumes have fallen, though average deal sizes remain larger than a decade ago, with deep-tech and life sciences attracting outsized interest.
For space decarbonisation, this means CFOs should see public funding as a hedge against VC volatility. Grants de-risk early-stage projects, making companies more attractive to private investors down the line.
For SMEs considering entry into the space decarbonisation ecosystem, a structured roadmap is critical:
At FI Group, we turn complexity into clarity for innovation leaders. With over 1,400 experts across 20 countries, we support more than 15,000 clients annually, securing over €1.7bn in funding.
Our advisory goes beyond funding applications. We help CFOs and executives:
As Dr. Fawzi Abou-Chahine, Funding Director at FI Group UK, explains:
“We support clients to navigate the most competitive EU and UK schemes. Our role is not just to write applications, but to align funding with strategic goals, whether that’s scaling internationally, strengthening IP portfolios, or accelerating net-zero innovation.”
Innovation does not stop at borders. Space and decarbonisation projects often require cross-continental collaboration, from launch facilities in South America to data analytics hubs in Europe and Singapore.
FI Group’s model ensures that:
This capability is critical during M&A, supply chain shifts, and expansions where funding incentives vary widely across jurisdictions.
The European Space Agency and Horizon Europe are the leading sources, with additional opportunities under LIFE, Clean Hydrogen JU, and Digital Europe.
Yes, but careful structuring is needed to avoid claiming the same cost twice (“double-dipping”). FI Group helps ensure compliance with HMRC and EU rules.
Horizon Europe success rates average 10–15%, but consortium-based applications led by SMEs with strong partners see higher success.
CFOs struggle with fragmented regulations, audit risk, and inconsistent reporting across jurisdictions. Integrated advisory support mitigates these challenges.
Because we combine global scale with local expertise, securing over €1.7bn in funding annually and offering tailored support for space and decarbonisation innovators.
The European Commission has published the latest edition of the 2025 European Innovation Scoreboard (EIS), confirming a positive long-term trend in the EU’s innovation capacity. Since 2018, the European Union’s innovation performance has grown by 12.6%, reflecting efforts to strengthen R&D ecosystems, promote public-private collaboration, and accelerate digitalization.
Although the most recent data show a slight slowdown (with an average decline of 0.4 points between 2024 and 2025), the overall outlook remains positive. All Member States have improved since 2018, with especially notable progress in key countries such as Spain, Belgium, Italy, Germany, and Portugal, where innovation ecosystems have continued to strengthen alongside a sustained commitment to public-private collaboration and business-driven R&D.
In Spain, several regions stand out for exceeding the European average:
Catalonia, the Basque Country, Madrid, Navarre, and the Valencian Community, consolidating themselves as competitive innovation hubs at the European level.
The 2025 Regional Innovation Scoreboard (RIS) presents a mixed but converging picture. Between 2018 and 2025, 233 out of 241 European regions improved their innovation performance, narrowing the gap between the most and least advanced areas. However, 82 regions recorded a decline between 2023 and 2025, highlighting a recent slowdown in some territories and underlining the need to reinforce policies that enhance competitiveness across all regions.
The European Innovation Scoreboard is not just a statistical report; it is a strategic reference tool for guiding public policy, planning investments, and supporting business decision-making. Its integration into the New European Innovation Agenda further strengthens its strategic role, helping to reduce disparities among countries, promote collaboration, and accelerate the adoption of cutting-edge technologies.
It also supports initiatives such as:
In a context of growing global competition and the urgent need for sustainable transformation, companies must take advantage of the funding and innovation incentives available. The strengthening of the European innovation ecosystem creates a favourable framework for:
At FI Group, we have teams specialized in funding programs, offering comprehensive support that covers everything from idea conceptualization, project definition, to fostering collaborations and coordinating proposals.
We accompany our clients throughout the entire project lifecycle, up to the final closure by the administration, including:
We turn opportunities into tangible results. With a strong presence across Europe and deep expertise in EU funding programmes, we support businesses in identifying and securing resources for innovation-driven projects.
If your organisation is looking to enhance its competitiveness through strategic innovation, explore how we can assist you via the EU Grants.
Talk to our experts and turn your ideas into real impact: Request a Free Audit
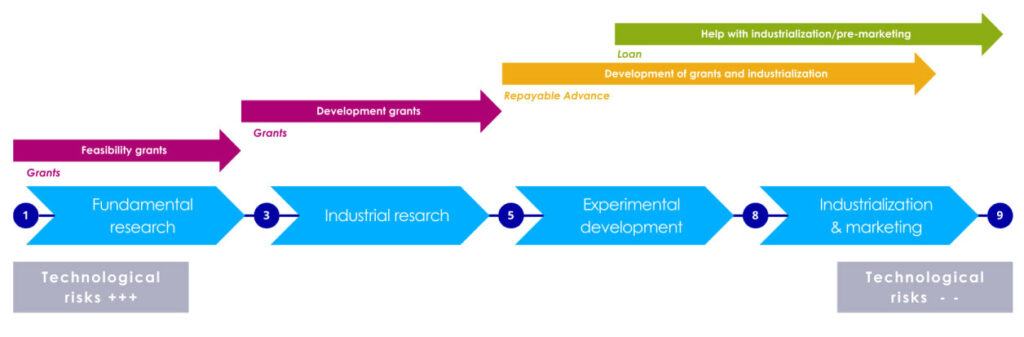
The Technology Readiness Level (TRL) scale is used to assess the technological maturity of an innovation or technology before its operational implementation. This tool is commonly used in the field of research and development (R&D) to provide a common understanding of a technology’s degree of readiness.
NASA (National Aeronautics and Space Administration) developed the TRL scale in the 1970s. Originally, this tool had 7 levels of maturity and was used to manage the technological risks of NASA programmes. It was not until 1995, however, that a final, global version of the scale was published, comprising 9 different maturity levels altogether.
The TRL scale is made up of nine levels, numbered from 1 to 9, representing different stages of technological development. Each TRL is associated with specific criteria that describe the characteristics and performance of the technology at that stage of development.
Evaluating a technology’s TRL enables us to understand where it is in its development cycle and to identify the remaining stages required to reach maturity and commercialization.
The scale is used by researchers, engineers, companies and organizations to assess the TRL.
In 2014, the TRL scale was incorporated in projects funded by the European Union (EU) as part of the Horizon 2020 framework programme.
The Horizon Europe programme then adopted the TRL scale as an indicator to improve the positioning of projects applied for in the programme. This unified scale enables applicants and evaluators to meet the expectations of the European Commission (EC).
This makes the TRL scale a key tool in the Horizon Europe 2021-2027 framework conditions for participation. To be eligible for funding, projects need to meet the following requirements:
| Activity | Funding rate | TRL |
| RIA Research & Innovation Actions | 100 % + 25 % | 4 – 6 |
| IA Innovation Actions | 70 % + 25 % | 6 – 8 |
| CSA Coordination & Support Actions | 100 % + 25 |
A higher TRL in a call text thus clearly indicates that the EC is looking for a more applicative solution within the project, while a lower TRL indicates that a more fundamental research project is expected.
The TRL is also used to indicate the ‘entry point‘, i.e. the maturity level of a given technology, product or process at the start of the project. In this case, the respective TRL serves as the ‘lower limit’.
In the application procedure for subsidies and innovation, funding agencies use the TRL scale to assess the eligibility of different innovative projects.
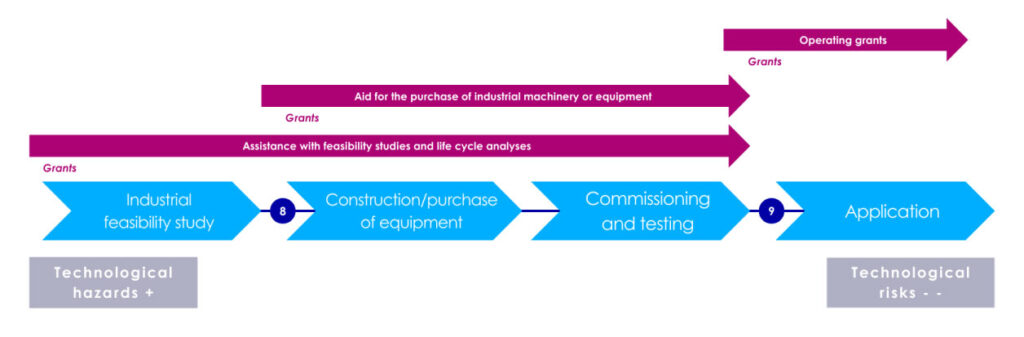
The TRL scale is also used to assess the eligibility of projects for tax credits, such as the Research Tax Credit (CIR) and Innovation Tax Credit (CII).
Projects in the early stages of development are eligible for CIR, while projects further up the TRL scale are eligible for CII.
Does your company develop technological projects? Do you want to know how much R&D expenditure you could claim? Discover the new FI R&D Tax Calculator and gain a clear understanding of your possibilities. Make the most of your R&D activities and claim the corresponding tax deductions!
Research and development plays a fundamental role in the advancement of science, technology and innovation. Organisation for Economic Cooperation and Development (OECD) countries recognize the importance of encouraging investment in R&D to boost economic growth and improve competitiveness.
In this sense, many countries have implemented a series of tax incentives to promote investment in R&D. These incentives seek to reduce the costs (and cover the risk) associated with research and development, encourage collaboration between companies and research centers, and stimulate the creation of highly qualified jobs in the private sector.
One of the most common incentives is the tax deduction for R&D activities. This scheme allows companies to deduct a percentage of R&D expenses from their tax base, which reduces the tax burden and increases the resources available for investment in research and development. Some countries offer additional deductions for the hiring of qualified personnel or for the acquisition of technological equipment.
Another incentive used in many OECD countries is the R&D tax credit. This mechanism allows companies to obtain a tax credit equivalent to a percentage of R&D expenses. Tax credit is a direct benefit that individuals can use to reduce the tax payable or even obtain a cash refund if the credit exceeds the tax owed, unlike tax deduction.
In addition to direct tax incentives, some OECD countries have implemented special regimes for research and development, which offer additional benefits, such as exemption from taxes on income derived from the exploitation of patents or reduction of taxes on profits from patents. capital obtained from the sale of assets related to R&D.
In many cases, R&D tax incentives are designed to encourage collaboration between companies and research centers. For example, some countries allow the transfer of R&D tax credits between companies, facilitating collaboration on joint research projects. Other incentives include the possibility of deducting R&D expenses carried out by third parties, such as universities or research centers, as long as effective collaboration is established.
It is important to highlight that tax incentives for R&D vary significantly between different countries. Each country has its own regulatory framework and establishes its own conditions and requirements to access tax benefits. Some countries offer more generous incentives, while others have stricter requirements. Therefore, it is essential that companies interested in taking advantage of these incentives consult the current legislation in each country and obtain appropriate advice.
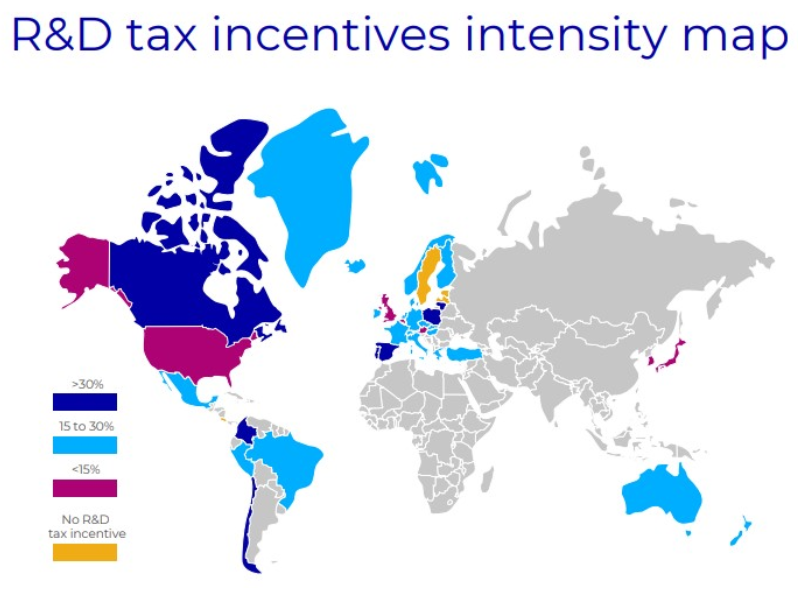
For this map to be representative of the different nature of R&D tax incentives (volume- based and incremental tax credits, super deduction), we took the scenario of a large company with R&D expenses during the last 10 years. Every year the amount of eligible R&D expenses is growing, as such, the claimant can apply for incremental R&D tax credits and deductions. The effective return on the R&D expenses is shown in the legend as a percentage of posttax reduction.
At FI Group we have extensive knowledge and experience in obtaining these tax incentives on different continents, with a global and coordinated strategy that is also complemented by the management and obtaining of public aid and subsidies for different types of investments. The combination of both incentives, from a strategic point of view and from a financial point of view, can mean for the company an important differentiation and competitive advantage within its scope of action.
FI Group has over 20 years of experience. Our specialized experts are at your disposal to analyze the fit of your project and advise you on obtaining tax incentives. Contact us.
Innovation and technological development lie at the core of FI Group’s DNA, filtering down through every member of the group. These elements are deemed indispensable for fostering growth and bolstering the competitiveness of any country.
This stemmed from the aftermath of the Covid-19 pandemic. Where both national and international policies strategically pivoted towards promoting investment in R&D&I and energy efficiency to reignite various sector’s work after the pandemic.
Regional, national, and European grants emerged as the primary public tools to drive economic revitalisation and foster growth across continents. Adequate public funding plays a pivotal role in facilitating the execution of large-scale R&D projects, which are critical for addressing the challenges posed by the prevailing political and economic landscape. These grants not only present opportunities for entities to confront these challenges but also serve as catalysts, inspiring innovation, differentiation, and investment to ensure development.
Currently, the continent boasts over 100,000 funding opportunities, encompassing regional, national, and European grants. Recognising the significance of these public funding opportunities, we have assembled a panel of experts from different countries to engage in a comprehensive discussion on the subject.
Among those attending this round table were:

1. First question: How many calls are there in each of your countries?
«Just imagine, according to the Spanish national database, in 2022 there were 62,817 calls for proposals,» –AV.
«At the regional level alone in this 2023, 459 calls have already been opened» –NZ.
«And we are only in May, we still have more than half the year ahead of us»- FAC to which Roberta explains that in Italy right now there are more than 650 published and waiting for the publication of another 97.
2. What do the calls for proposals mean for the different companies?
«I think we all agree that these calls for proposals, at all levels and for all types of companies, mean the possibility of making an investment or starting a project that would otherwise be difficult to carry out,» –VO.
«I totally agree. In addition to the fact that it makes it possible to grow the business and expand into new markets, and even to become known as a key player in the different sectors, especially in R&D calls,» –RD
«We cannot forget that it has an incentive effect, and that it also makes it possible to achieve results in a shorter period of time than would be possible without these calls». – AV
3. What role does FI Group play in the achievement of these objectives? How can we accompany the different companies in these processes of application to the different calls?
«At the level of the processes of fitting into the calls, application, monitoring and justification; for a company it is a tremendously bureaucratic and complex process. Being able to count on a trusted partner with years of experience is essential,» –AV *while her colleagues nod in agreement.
«With the support of a specialised agent or one that is close to the convening agency is a «privilege» that few actors have in this ecosystem. FI Group has a long experience and great success in all the stages that my colleague explained earlier,» -FAC
«We have teams of experts in both technical and financial areas, without forgetting that we are part of the ecosystem and know all the parties involved, being active and proactive in creating value propositions to improve the systems and funds so that they are more attractive and competitive,» –MO
«We also help to involve one or more stakeholders in relation to the sector or area, and we help and accompany them to improve collaboration. This is precisely due to a large global database of contacts that we have been working on during the 20 years of FI Group’s existence, which allows us to support our clients in an aggregated way, both at multi-country, multi-sector and multi-service levels».-RD
«Absolutely. To a great extent to the experience acquired, the knowledge, the connection networks, we have the capacity to offer this multi-country, multi-sector and multi-service service, but we also continue to do it as the first day, with an individual team per client, with an exclusive and close accompaniment, always making their project ours» –NZ
4. What are the most strategic sectors right now?
«I think we all agree that currently the most strategic sectors, not only for FI Group but for the whole of Europe and therefore for our clients, are industry in general and specifically all the electro-intensive ones, as well as everything related to energy, decarbonisation and hydrogen,» –NZ
«Automotive, ICT, Tourism, biotechnology, textile, chemical…». – MO
«From FI Group we continue and will continue to accompany all companies in achieving their objectives and their R&D&i projects, solving their doubts, finding the best fit in consortia or accompanying them in the justifications of the calls they have already achieved. This is and will be the driving force of all the colleagues who are part of this company». –VO
Hit the links below to access their LinkedIn profiles:
The pandemic has led to a global economic and social crisis, and the European Union and Member States have had to adopt emergency measures. Among these, the creation of an exceptional temporary recovery instrument, the NextGenerationEU, has been agreed.
FI Group is an active player in multiple European countries that will benefits from NextGenerationEU. These countries include:
FI Group has already developed a dedicated up and running Next Generation team in each of the countries listed. These teams are qualified to handle any questions or requirements your company might have regarding NextGenerationEU.
This recovery instrument is supported by 750 billion euros, part of which will be provided in the form of repayable loans (360 billion euros) and part of which will be provided in the form of non-repayable transfers (390 billion euros).
The EUR 750 billion will be distributed through different tools:
At FI Group we are supporting the entire value chain (startups, SMEs, large companies, knowledge centres, etc.) in areas such as:
If you want to find out more about how your company could benefit, get in contact with our team today!


